2026 · search and rescue · Raspberry Pi 5
Drone Ranger
Mapping people and vehicles from a drone, with an error bar on each
A drone's camera sees boxes in a picture, not places on the ground. I built a system that finds each person and vehicle in the video, works out where they are on the ground, and pins them on a map it builds from its own frames. Every position comes with an error bar. It is designed to run on a Raspberry Pi 5 carried on the drone, with no GPU and no internet connection.
Research prototype. Tested on public datasets and in simulation, not yet flown.
4.5%
typical distance error over uneven ground, with the drone working out its own position
error bars correct 84 to 95% of the time, against a 90% target
The system's own output, drawn in 3D: the drone's camera sweeps the ground, the map fills in where it has looked, and a pin drops for each person (orange) and vehicle (teal). The town is simulated (SynDrone), so the drone's position is known exactly. Pins and the drone are drawn larger than life.
Built for a search team looking for one missing person
Search and rescue is the purpose of this project: a team of drones looking for a missing person. The same system could serve anti-poaching patrols, site security, and traffic and crowd surveys, and with a detector retrained for animals, wildlife counts.
I tested it on that search, with four drones in simulation. Four findings came out. Two are good, and two set the next work.
What works
4.5%
Typical distance error over uneven ground, with the drone working out its own position from its camera, motion sensor and GPS.
84 to 95%
Error bars that hold. How often a 90% error bar contained the true distance on test data.
169 s
Saved when a drone is lost, by searching as a team instead of on fixed lanes.
What it struggles with
47% and 6%
People found from 20 m and from 50 m. From higher up, a person is only a few pixels.
1,861
False alarms reported to the crew before the real person is found. Far more than a crew could check.
A camera gives direction, not distance
Step 1 · The ray
Each box tells me the direction of an object from the camera. To turn that into a distance, I follow the line of sight through the bottom of the box, where the object touches the ground, until it meets the ground.
Step 2 · The usual shortcut
The catch is knowing where the ground is. The usual shortcut assumes the ground is flat and that the drone knows its height above it. On a slope the line carries on to an imaginary flat ground, and the distance comes out far too long. A real drone does not know its height above the ground anyway.
Step 3 · Terrain from motion
So instead I measure the shape of the ground from the drone's own motion. The same patch of ground, seen from two positions a fraction of a second apart, can be triangulated, the way two eyes judge depth. The line now meets the real surface, at the car.
Follow one person through the system
Every frame passes through seven steps. Each one adds something to what the system knows about the person, shown in the box under each step. Placing them on the ground also takes two extra inputs: where the drone is, and the shape of the ground beneath it.
- 1
Video frame
from the drone's camera
Adds: frame at 50 m
- 2
Detect
D-FINE N, fine-tuned on drone footage
Adds: box: person
- 3
Track
my own tracker, motion and overlap only
Adds: person, ID 14
- 4
Place on the ground
the line of sight, down to the ground
Adds: 53 m from the drone
- drone position: camera, motion sensor, GPS
- ground shape from motion
- 5
Error bar
propagated, calibrated, flagged
Adds: placed to within 0.4 m
- 6
Search map
a pin on a map built from the drone's own frames
Adds: pin for the crew to check
- 7
Team search
shared with the other drones by radio
Adds: about 34 bytes a second
Person 14 from the flight at the top of the page. The radio figure is the team's average per drone.
Detect and track
The detector is D-FINE N, a small, fast transformer model, which I fine-tuned on VisDrone, a dataset of drone footage. I wrote the tracker myself, from the published methods. It follows people and vehicles using only their motion and how their boxes overlap, so it never analyses faces.
Version 1 used a YOLO detector and tracker from a library under the AGPL licence. I replaced both so the code can be Apache-2.0 and go into a product. That cost some accuracy, and I report it: identity F1 on the test set fell from 0.76 to 0.69 for vehicles, and from 0.44 to 0.32 for people.
VisDrone test footage, tracked by version 2. Each colour and number is one identity, kept from frame to frame.
Finding 1
Distances are typically within 4.5%
To score a distance I need the right answer, so I tested on simulated flights where every true distance is known. In rendered towns, with the drone's position known exactly, the typical error for the people and vehicles it found was 0.6% and 0.4%.
A real drone has to work out its own position. With the positions from my own navigation filter, over uneven ground, the typical error was 4.5%, on test flights the system had never seen.
Typical (median) distance error
Why I built my own navigation
Triangulating the ground depends on the small change in the drone's position between frames, so that change has to be accurate. In version 1 I assumed three grades of navigation, and only the best one kept errors low.
So I built a filter that fuses the camera, the motion sensor (IMU) and GPS. Its positions beat the best grade I had assumed, and its own uncertainty, carried into each error bar, keeps the bars honest: they held 92% of the time where 90% was promised.
| Drone positions | Distance error | 90% bar holds |
|---|---|---|
| Exact, from the simulator | 2.5% | 78% |
| My filter: camera, motion sensor and GPS | 3.8% | 92% |
| Assumed good navigation | 6.3% | 51% |
| Assumed typical navigation | 12.0% | 46% |
| Assumed poor navigation | 36.9% | 53% |
Median distance error on 15 Mid-Air development flights, terrain from motion. On the 9 test flights, run once: 4.5% with the filter, 3.1% with exact positions.
The flat-ground shortcut breaks on hills
The steeper the ground, the worse the flat assumption gets: its error grows from 6% on level ground to 24% on slopes above 45°, even when it is given the true height. Terrain from motion stays at or below 3.7% on slopes up to 45°.
Finding 2
Error bars that say how far to trust it
Every distance comes with an error bar, because a number you cannot trust is worse than no number. "46 ± 3 m" means somewhere between 43 and 49 metres. An error bar is only honest if the truth really does land inside it as often as it claims.
I work out each error bar from the sensor noise, then calibrate them on separate flights using split conformal prediction, so they are wide where the system is unsure and narrow where it is not.
What an honest error bar looks like
Promised 90 in 100. Delivered 84 to 95.
A 90% error bar promises to contain the truth 90 times in 100. Over uneven terrain, straight from the sensor noise, mine managed 74. After calibration, 84. That is still 6 short, which tells me the test flights differ more from the calibration flights than the method assumes, so I report it as it is. In the rendered towns, the bars on people and vehicles held 95 and 93 times in 100.
A separate warning flag, a small model built on features I can explain, marks the distances most likely to be badly wrong. So far it catches 56% of them.
Promised90 in 100
Uneven terrain, before calibration74 in 100
Uneven terrain, after calibration84 in 100
People in rendered towns95 in 100
Vehicles in rendered towns93 in 100
Each dot is a distance
This is Mid-Air, a simulated drone flight made in a game engine: a camera flying low over grass, rocks and hills. Because the world is simulated, the true distance to every pixel is known, so every estimate can be checked exactly.
Each mark is one distance estimate, pinned to its spot on the ground as the drone flies past.
- Within 10% of the true distance
- More than 10% off
- Amber: the warning flag was raised
Finding 3
Searching as a team saves 169 s when a drone is lost
Four drones split the area into lanes and tell each other which lanes they have finished. Each sends about 34 bytes a second, small enough for a basic radio. If a drone goes silent for 60 seconds, the others treat it as lost and fly the lanes it had not finished.
The camera in the simulation is not assumed. How often it sees a person, and how often it raises a false alarm, were measured from the real pipeline's output on rendered towns, at the same heights and angles.
A simulated search where the lost drone matters, because the missing person was on its ground. Drone 3 goes silent and the others fly the hatched strip it left. As a team, they found and confirmed the person after 28 minutes. On fixed lanes, the person was still not found when the search was called off at 68 minutes. This case was chosen by a written rule, and cases like it came up in 13 of 200 trial searches.
Against the usual plan
The usual plan gives each drone its own fixed lanes. Over 300 simulated searches, losing one of four drones added 196 s to a search done as a team, against 365 s on fixed lanes. With no drone lost, neither plan was measurably faster.
My first plan, where drones chased the most likely places on a shared map, was far slower. Recurring false alarms kept pulling it back to the same spots. I report it as a negative result.
Seconds added when one of four drones is lost
Finding 4
The camera limits the search, not the flight plan
From 20 m the camera finds 47% of people. From 50 m it finds 6%. So the drones have to fly low, and flying low is slow: four drones take 23 minutes to cover an area from 20 m that they could cover in 6 minutes from 80 m.
Too many false alarms
The system also reports people where there are none. Most of these false alarms come back to the same places on every pass, so a place is reported to the search crew only after it has been seen twice. That cuts the false alarms before the real person is found by more than two thirds. It is still far more than a crew could check.
every sighting
6,277
seen twice
1,861
False alarms before the person is found, per search, on average. Four drones, simulation.
The end of the flight at the top of the page: two minutes, 0.25 km² searched. Orange pins are people, teal vehicles. Grey rings are false alarms: 75 of the 92 "people" were look-alikes.
Small people are the weak point
Both problems have the same cause. The detector learned from city streets filmed from lower down, where people look bigger. From search height a person is only a few pixels, and so are many fixed objects.
All four people marked here are from one frame. The closest is 159 pixels tall; the furthest only 24, a smudge of colour. The tracker follows 84% of people taller than 128 pixels, but only 6% of those between 16 and 32 pixels, and nearly a third of the people in the test footage are that small.
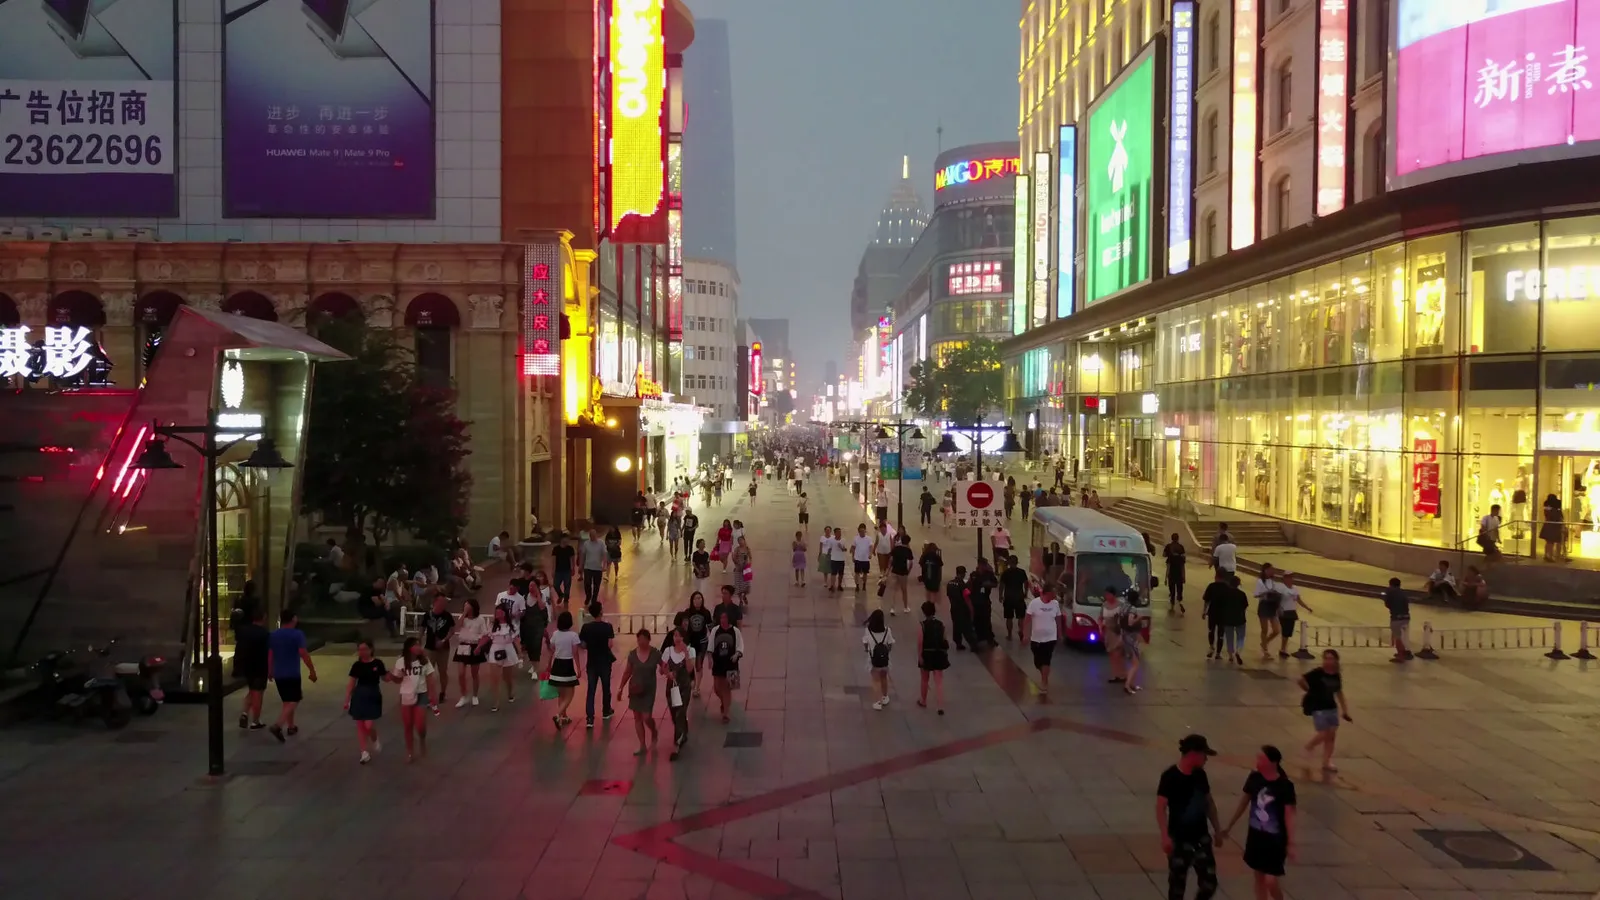
0 to 16 px

16 to 32 px

32 to 64 px
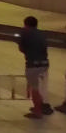
64 to 128 px
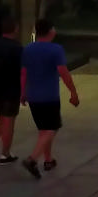
128+ px
The next step: a thermal camera
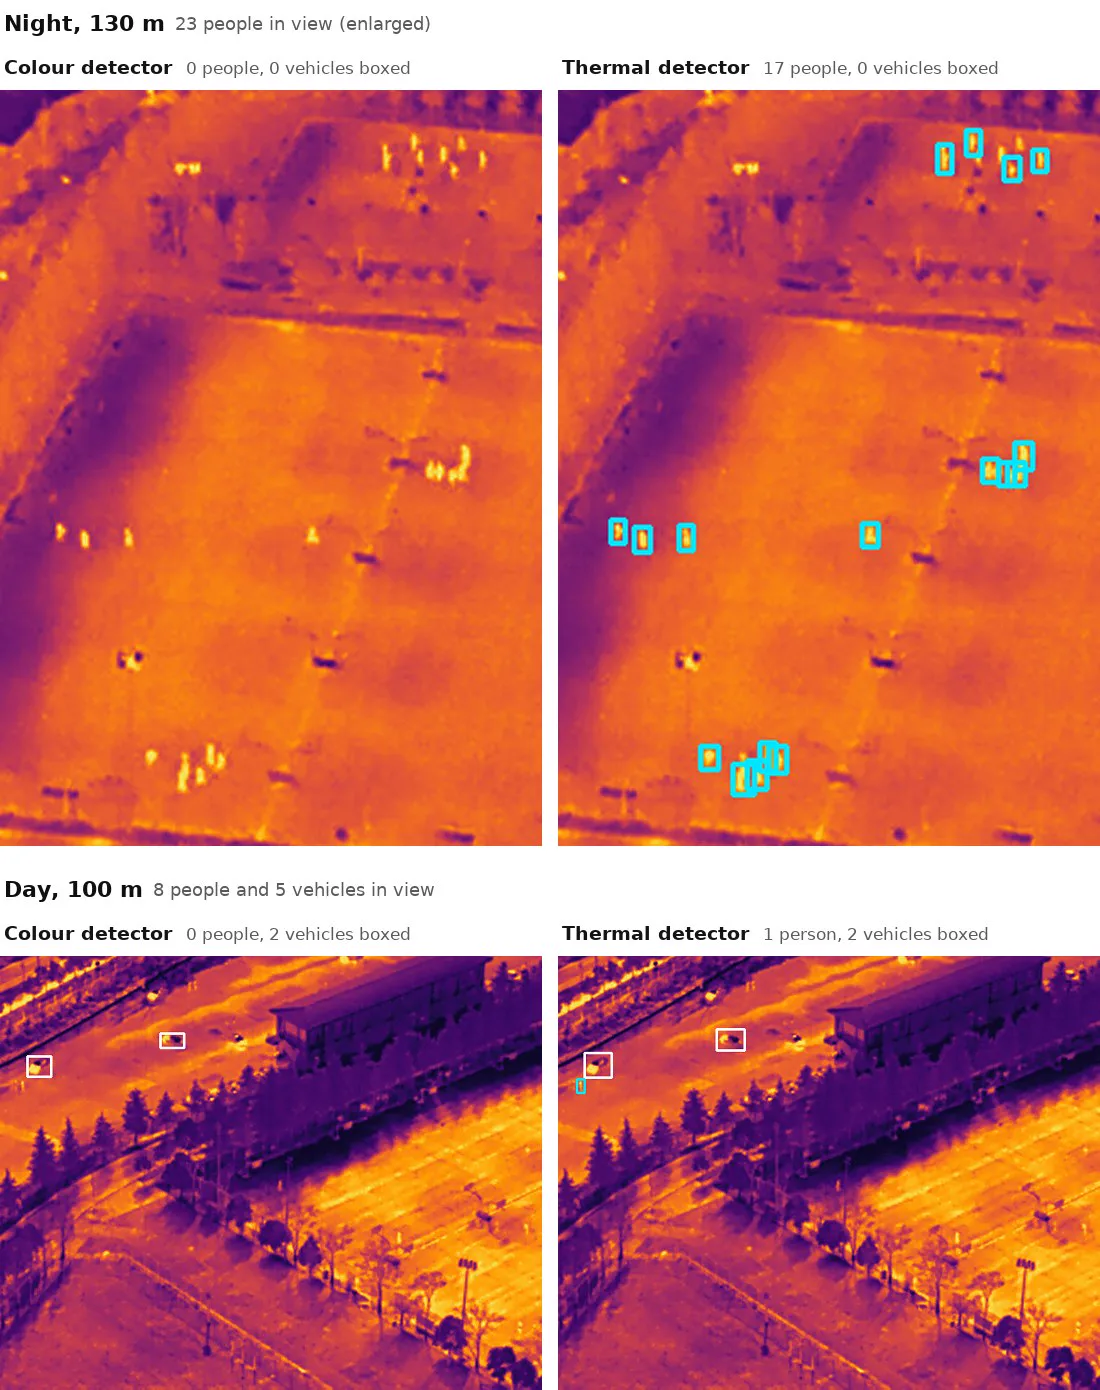
People show up warm against cool ground. A detector I trained on thermal images already finds people on days it never saw, by night as well as by day. It scores 0.69 for people, against 0.06 for the colour detector on the same images (AP50, a standard detection score from 0 to 1).
It does not yet carry over to every thermal camera. On night patrols over wildlife areas, filmed with a different camera, only 20% of what it tracks as people are people. Training on that kind of video is next, along with footage filmed from search height, and a closer second look as soon as something is seen.
Real footage is the weakest test so far
AU-AIR is real traffic filmed from a low drone at one site. It records GPS and altitude, but not the camera's lens or tilt, so I estimated both from the footage itself. There are no true distances, so only consistency can be measured: parked cars' positions repeat to within 7.6% of their distance.
The detector transfers poorly here. Version 2 scores AP50 0.20 for vehicles and 0.04 for people, about the same as version 1's 0.21 and 0.02, so many objects are never ranged. The next step is a real flight past people and vehicles at known positions.
A held-out AU-AIR flight, ranged with version 1's detector. It was recorded at 5 frames a second; the frames in between are generated so it plays smoothly. Green tags are reliable, amber uncertain.
No GPU. A laptop CPU, the AMD Ryzen 7 5700U.
Built for a small computer on the drone
12.7 frames a second
The whole pipeline on a laptop processor, detecting on every second frame while the tracker predicts in between.
Raspberry Pi 5: the detector is estimated at about 285 ms per detection. Estimated, not yet measured on the board.
One Docker image for a laptop and for the Pi's ARM processor, with matching outputs on both (checked under emulation).
A ROS 2 node, the standard software framework for robots, so it can sit beside a drone's autopilot.
No internet needed. The map is built from the drone's own frames, with no map service.
The one test still missing
Each dataset checks a different part of the system. Rendered towns now run the whole chain, from video to distance, against the truth. But they are rendered, and no real dataset has both labelled objects and their true distances.
The next step I would take is a real flight past people and vehicles at known positions, scored end to end.
Every known limitation, with numbers| Dataset | Real footage | Labelled objects | True distances |
|---|---|---|---|
| VisDronescores tracking | yes | yes | no |
| Mid-Airscores distance and navigation | no | no | yes |
| SynDronethe whole chain, rendered towns | no | yes | yes |
| AU-AIRreal flights | yes | yes | no |
| HIT-UAVthermal camera | yes | yes | no |
| Next testa real flight, known positions | yes | yes | yes |
How it is built
- Python
- PyTorch
- D-FINE
- ONNX Runtime
- OpenCV
- NumPy
- SciPy
- Kalman filter
- Conformal prediction
- ROS 2
- Docker (x86 and ARM64)
- pytest
- 722 automated tests, run on two Python versions on every change
- The whole program built and tested for the Raspberry Pi's ARM processor on every change
- Every number on this page generated from a results file by a script
- Each test set run once, after every setting was frozen
- Each hypothesis written down before its test, and every decision logged with its evidence
- Apache-2.0 code. People are boxes and positions only, with no face analysis
Footage and data: VisDrone2019 (Zhu et al., IEEE TPAMI 2021, research use), Mid-Air (Fonder and Van Droogenbroeck, CVPR Workshops 2019, CC BY-NC-SA 4.0), SynDrone (Rizzoli et al., ICCV Workshops 2023, CC BY), AU-AIR (Bozcan and Kayacan, ICRA 2020, non-commercial use with attribution) and HIT-UAV (Suo et al., Scientific Data 2023, CC BY 4.0). Detector: D-FINE (Peng et al., ICLR 2025, Apache-2.0). Version 1's detector and tracker: Ultralytics (AGPL-3.0). Lost-person statistics for the search simulation: Koester, 2010. People and vehicles are tracked as boxes only, with no face analysis.
Have a role in mind?
If you are looking for a spark of curiosity, energy and growth in your team, and have a role that suits my CV, let me know. Email is the fastest way to reach me.
Guildford, UK · Right to work in the UK, no sponsorship needed