Sorting line · 2025
Industrial Waste Management System
Rubbish on a real conveyor belt is crushed, dirty and piled on top of each other. I built a computer vision system that can tell what each item is, find it and outline it, then made the models smaller so they could run on site and be useful in the real world.
- Python
- PyTorch
- YOLOv10
- DeepLabV3+
- Swin-T
- CLIP
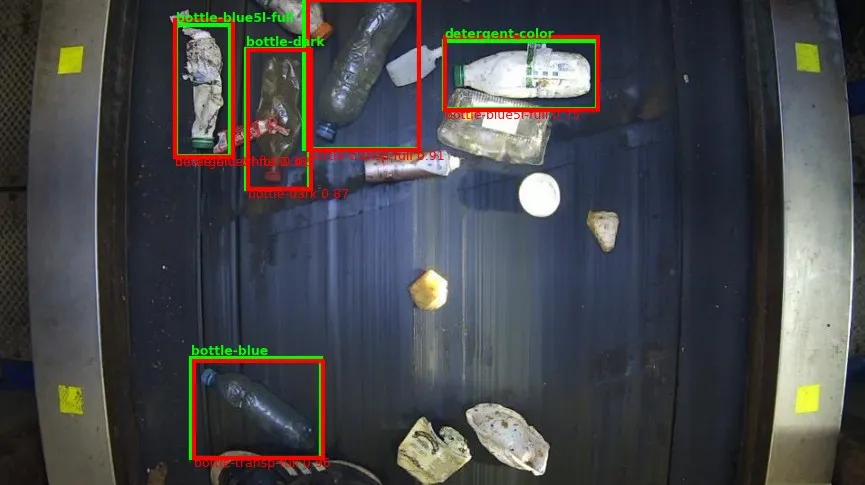
Station 1 · three tasks
Classification, detection and segmentation
Each of these tasks needs a different kind of model. For each one I trained and compared several models and kept the best.
Classify
What is this item?
88.89%accuracy
Out of every 100 items, about 89 were given the right label.
Chosen model: Swin-T
Detect
Where is each item?
59.29%mAP@0.5
A combined score for finding items and boxing them tightly, in a pile where most things overlap.
Chosen model: YOLOv10
Segment
Which exact pixels belong to it?
83.89%mIoU
On average the model's outline and the true outline overlapped by about 84%.
Chosen model: DeepLabV3+
Station 2 · explainability
Explainability with Grad-CAM
A score tells you how often a model is right, but not why. Grad-CAM shows where the model was looking when it made its decision, with red where it paid the most attention.
All three items here are blue bottles. The model got the first two right by looking at the bottle itself. On the third it focused on a white wrapper and called it a milk bottle. The classes are very similar (blue bottle, five-litre blue bottle and milk bottle are all separate), and once they are crushed they are hard to tell apart even for a person.
Heat maps from EfficientNet-B3, one of the classification candidates I compared.
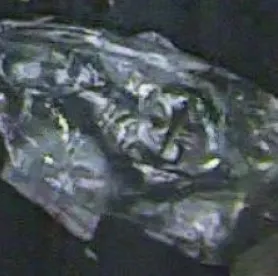
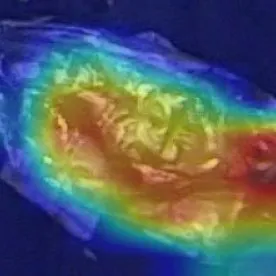
model said bottle-blue
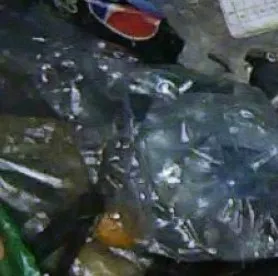
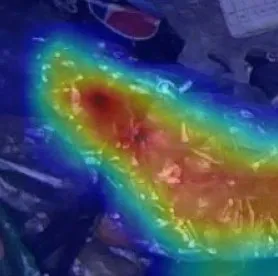
model said bottle-blue
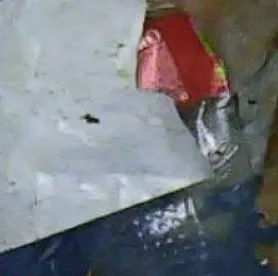
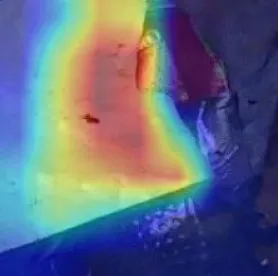
model said bottle-milk
Station 3 · augmentation
Data augmentation
Labelled photos of rubbish are expensive to collect. Augmentation changes each training photo slightly every time the model sees it, so it learns what the item looks like and not just the exact picture.
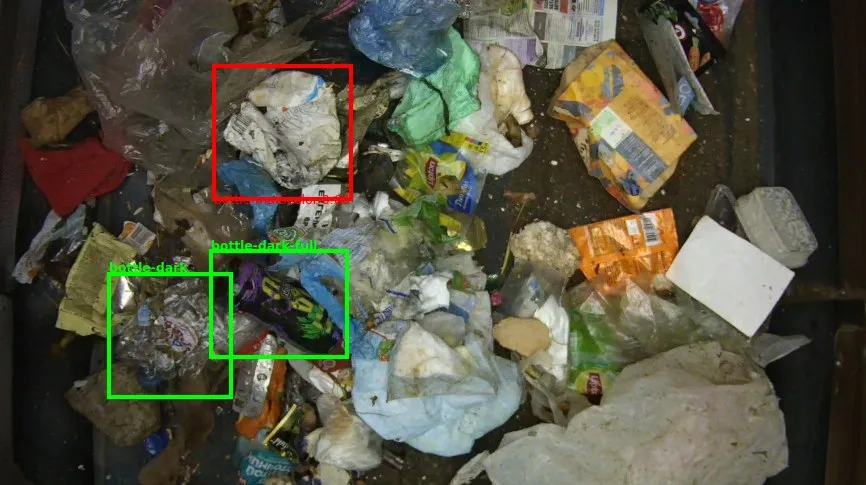
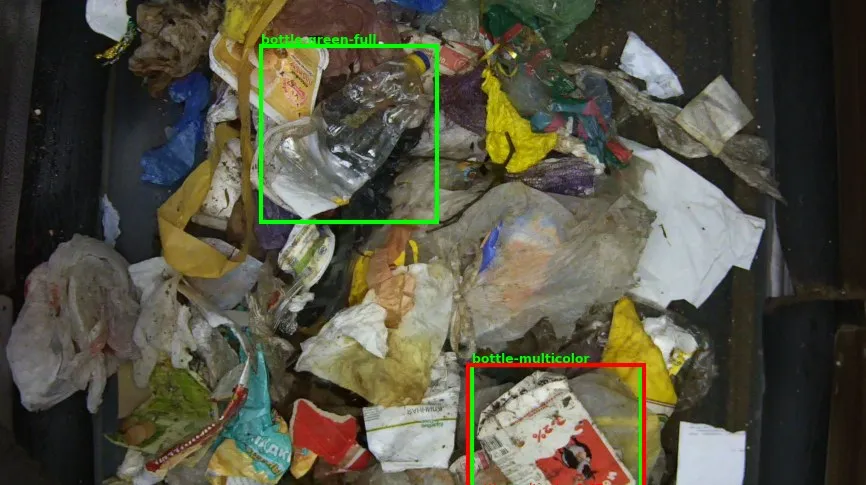
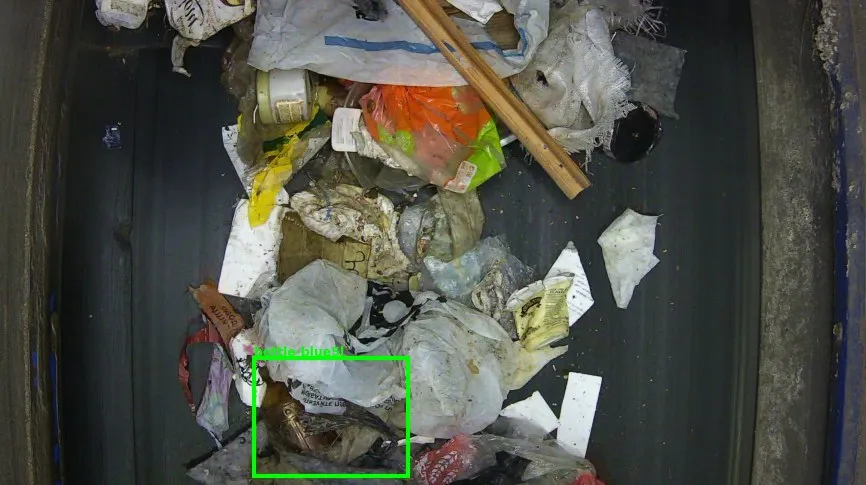
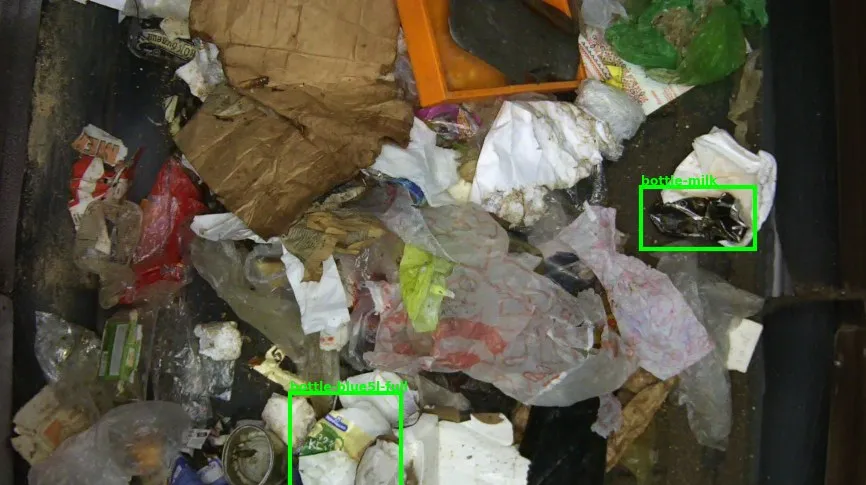
Mosaic
Four photos stitched into one, so items appear at new sizes and beside new neighbours.
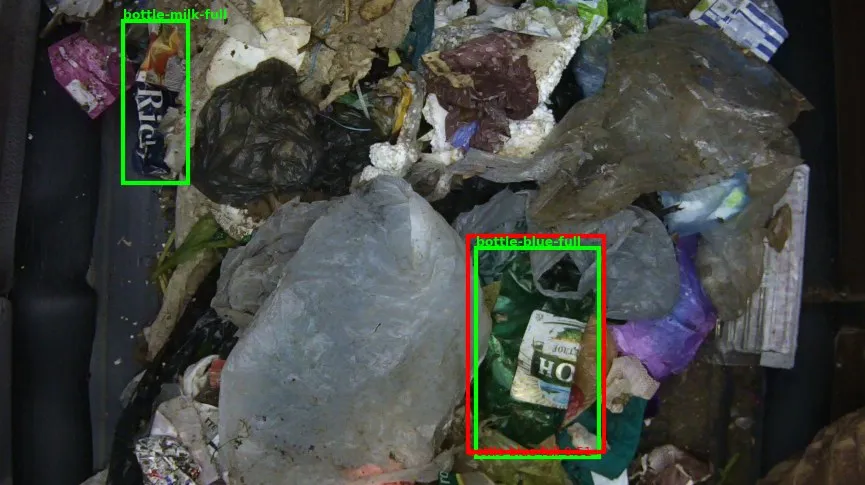
Colour jitter
Brightness and colour shifted, as the lighting over a belt changes through the day.
Geometric
Flipped, turned and scaled, because rubbish does not arrive the right way up.
These three pictures show each idea using my test photos. They are not the training images themselves.
Station 4 · deployment
Quantisation and pruning
A model is made of millions of numbers, each normally stored in 32 bits. Quantisation stores each one in 8 bits, a quarter of the size, for only a small loss in precision. Pruning removes the connections that matter least. Together they make the model lighter and faster, so it can run next to a real sorting line.
End of the line
How it is built
A multi-task pipeline classifying, detecting and segmenting industrial waste in crowded waste areas, built on a public Kaggle dataset.
- Detection: mAP@0.5 59.29% (YOLOv10)
- Segmentation: mIoU 83.89% (DeepLabV3+)
- Classification: 88.89% accuracy (Swin-T), with GradCAM explainability and CLIP zero-shot evaluation
- INT8 quantisation and pruning for deployment efficiency
- Synthetic augmentation pipelines: mosaic, colour jitter, geometric transforms