MSc dissertation · 2025 – 2026
Neural Marker Identification for Closed-Loop Parkinson's Therapy
I used explainable AI to look for neural biomarkers in Parkinson's patients: the brain signals that show whether their medication is working. Monitoring today focuses on the beta range, 12 to 30 Hz. My results point to a slower range, 4 to 10 Hz.
Supervised by Dr Shlomi Haar, University of Surrey
1 · the idea
Monitoring Parkinson's with EEG
People with Parkinson's take levodopa to control their symptoms. As a dose wears off they move from an ON state to an OFF state. If a device can read that change from the brain, medication or deep brain stimulation can adjust itself. This is called closed-loop therapy.
The current standard watches beta activity, between 12 and 30 Hz. When I asked my model what it was using to tell ON from OFF, the answer sat lower down, between 4 and 10 Hz. If that holds up, it could make closed-loop treatment far more effective.
I chose this project because I have always been drawn to the medical field, and neurology is one of the most interesting parts of it.
- 4 to 10 Hz where my model looked
- 12 to 30 Hz beta, the current standard
2 · the evidence
Finding the 4 to 10 Hz range
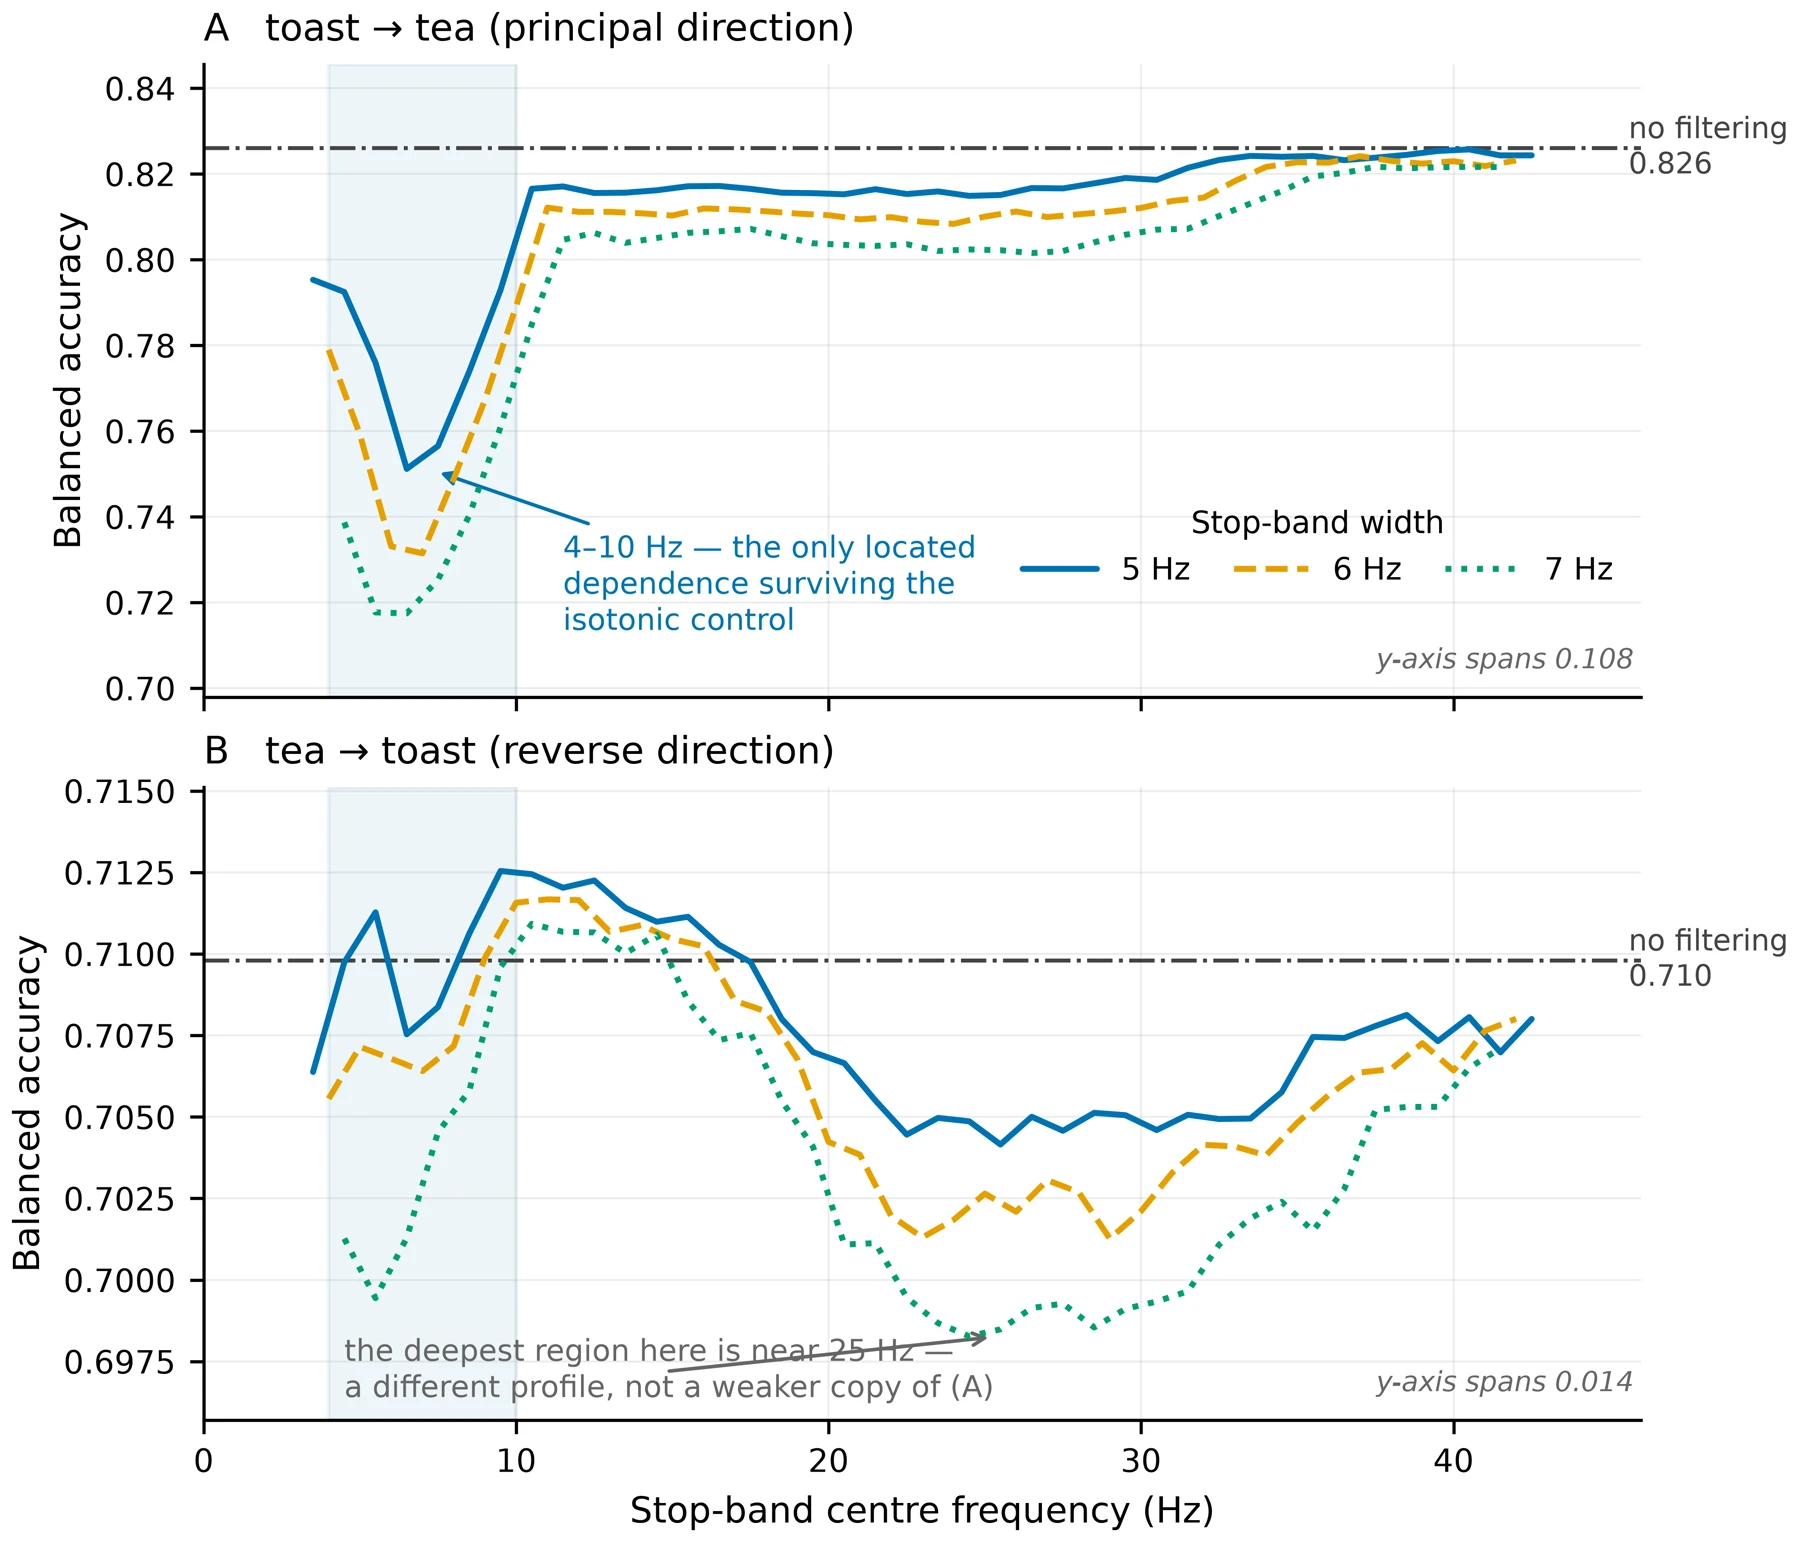
To test it, I filtered out one narrow slice of frequencies at a time and measured how far the model's accuracy fell. Removing anything between 4 and 10 Hz hurt the most, taking it from 0.826 to about 0.75. Removing slices of the beta range barely changed it.
Four explainable AI methods pointed the same way: GradientSHAP on the model's input, an analysis of the internal tokens it relied on, KernelSHAP across whole sequences, and an XGBoost probe as an independent check.
The same slow range showed up across patients too. The share of energy between 4 and 5.5 Hz was the only measure that told ON from OFF in people the model had never seen (0.657, p = 0.020).
3 · the data
The data and preprocessing
Each patient wore a cap of 19 dry electrodes while doing everyday tasks like making tea and toast, once ON and once OFF. Dry electrodes are quick to put on, which is what a device used at home would need, but they pick up far more noise than the gel electrodes used in hospitals. Add people moving around a kitchen, and much of what the cap records is not brain activity.
Cleaning that up was one of the hardest parts of the project. Every recording went through the same pipeline before any model saw it:
- 1Resample300 to 200 samples a second
- 2Filterremove drift and mains hum
- 3Re-referenceto the average of all channels
- 4Windowcut into 10-second pieces
4 · the hardest test
Testing on new patients
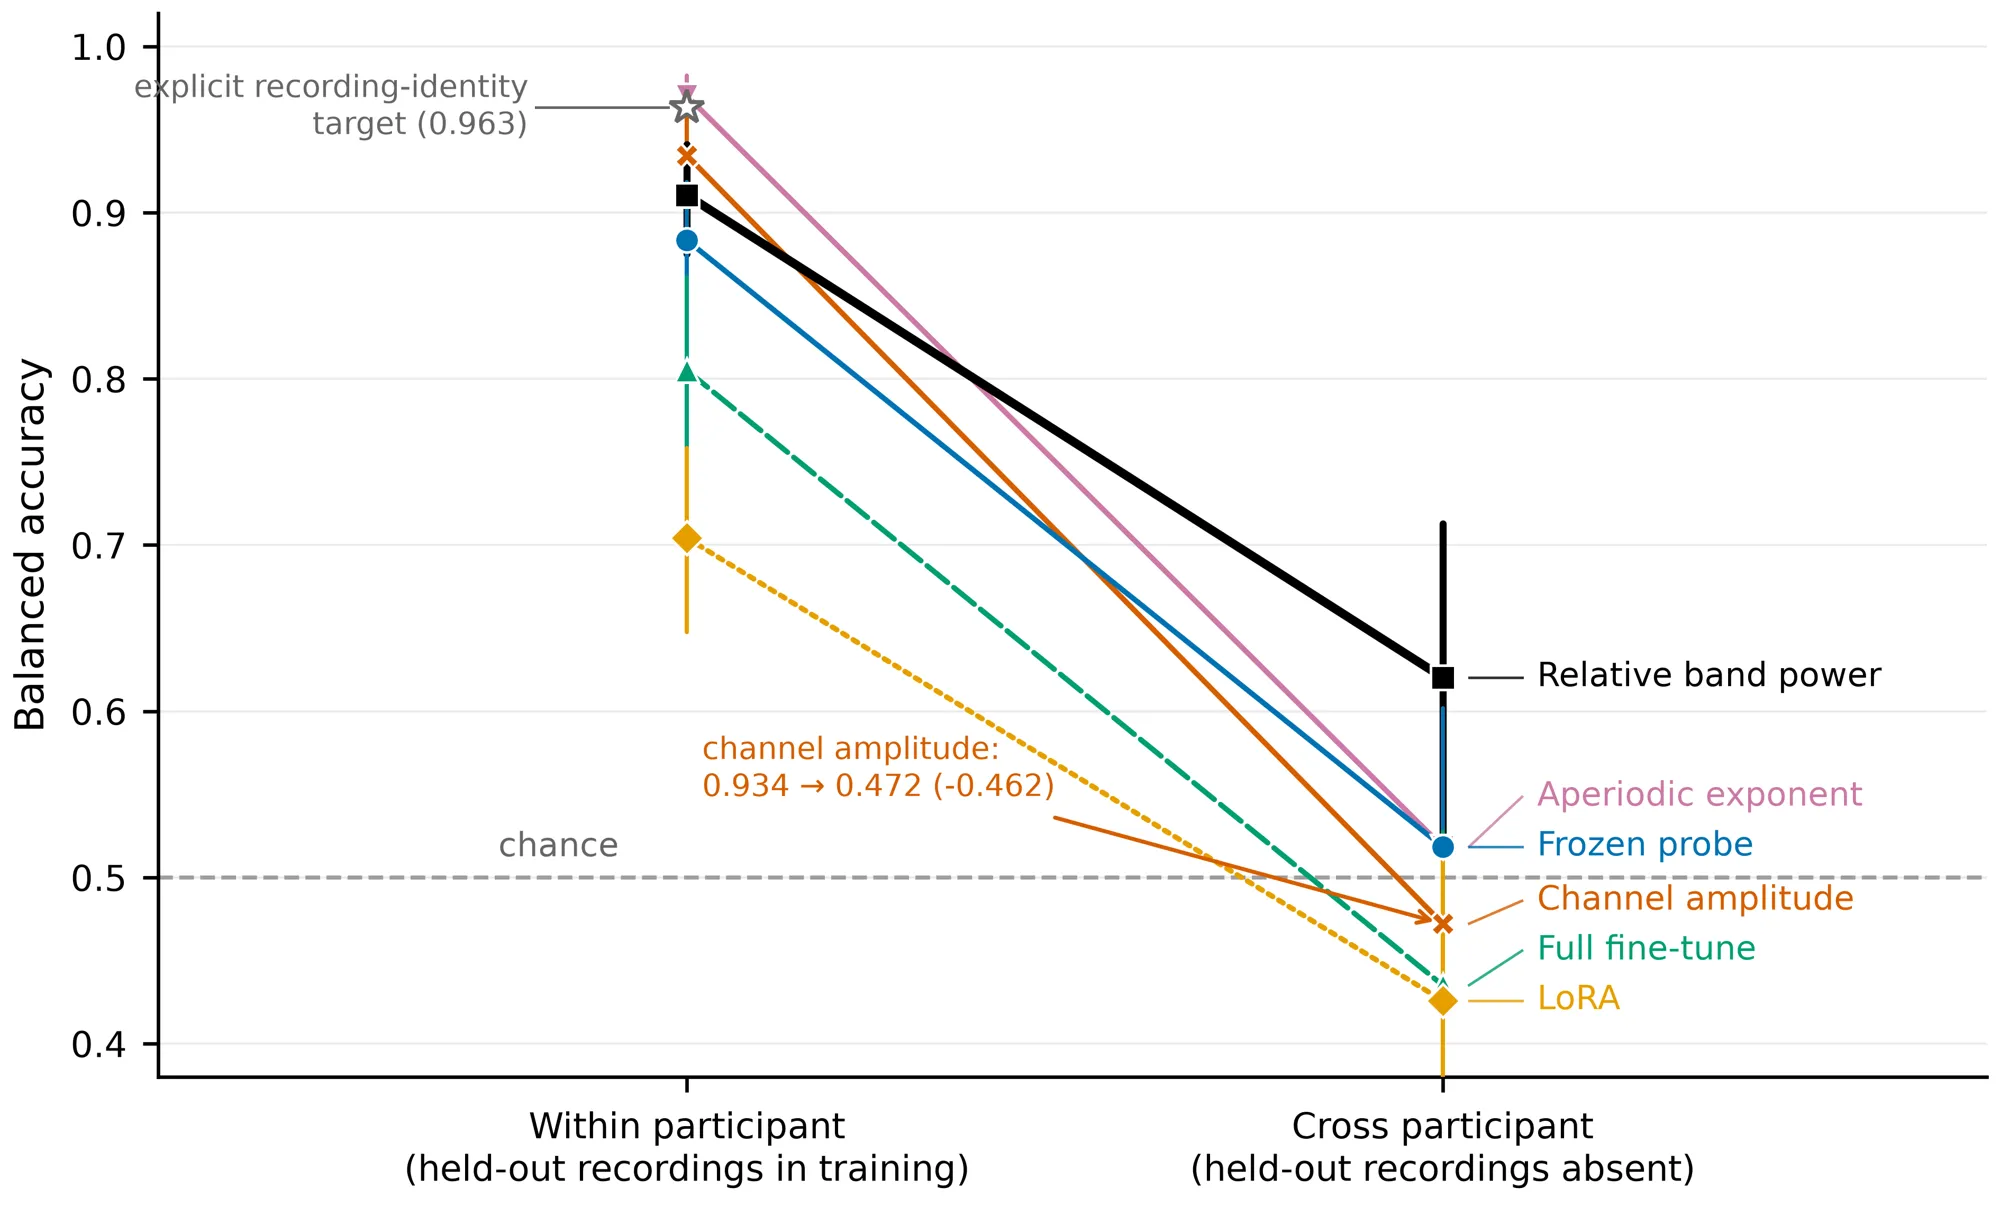
Inside one patient the model did well. Trained while they made toast and tested while they made tea, the fine-tuned model scored about 0.83, where 0.5 is a coin flip and 1.0 is perfect.
A treatment device has to work on someone new from day one, so I held each of the 35 patients out in turn, trained on the other 34 and tested on the one left out.
held out for testing, each patient in turn
This was the hardest part of the project. Every version of the model fell into the "no effect" range I set before I started. Brain signals differ so much from person to person that what the model learns from one patient does not yet carry over to the next.
5 · why I trust the answer
Checking the results
In medical data a surprising result is usually a mistake, so I spent a lot of time trying to prove my own results wrong before trusting them.
- 01
A control that ignores the brain
A model using only how loud each channel was scored 0.934 within a patient, higher than any of mine, then fell to chance on new patients. Within-patient scores on their own cannot be trusted.
- 02
Shuffled labels
With the answers scrambled, the pipeline scored 0.500 on average. It cannot produce a result from nothing.
- 03
A line drawn in advance
Before seeing any results I wrote down that 0.60 or below would count as no effect, so I could not move the goalposts afterwards.
- 04
Can it tell patients apart?
Yes, about 15 times better than chance. The model recognises who it is listening to far more easily than what state they are in.
- 05
Matched recording lengths
ON and OFF recordings differ in length. Matching them moved every result by 0.023 or less.
- 06
Blinks the cleaning tool missed
The standard automatic labeller missed seven eye-blink components. I caught them with a second check against the forehead channels.
6 · what I would do next
Next steps
The study also recorded motion sensors, which I have not used yet. Movement is the clearest outward sign of Parkinson's, so pairing it with the EEG would show whether the 4 to 10 Hz signal follows how well someone is actually moving. That would make the findings more robust and more likely to apply to a wider range of patients.
Method
How it is built
- Python
- PyTorch
- CodeBrain
- GradientSHAP
- KernelSHAP
- XGBoost
I fine-tuned CodeBrain, an EEG foundation model published at ICLR 2026, on recordings from people with Parkinson’s disease, to find brain signals that show whether their levodopa medication is working. The long-term aim is treatment that adjusts itself.
- Full preprocessing pipeline for 19-channel dry-electrode EEG: 300 to 200 Hz resampling, bandpass and notch filtering, common average re-referencing, 10-second windows
- Two study designs: leave-one-patient-out across 35 patients, and a within-patient task split across 27
- Three ways of adapting the foundation model (frozen probe, LoRA, full fine-tune), compared against simple classical features
- Explainability framework: GradientSHAP on the patch encoder, codebook token analysis, KernelSHAP at token level, and an XGBoost probe as a cross-check
- Negative and positive controls, duration matching, and a null band written down before the results were seen